

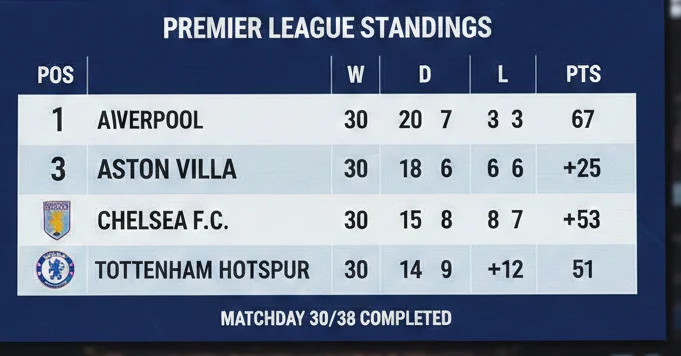
Aston Villa vs Chelsea F.C. Standings & Comparison
Aston Villa’s recent winning form has pushed them into the top three, while Chelsea remain strong contenders for European spots. Head-to-head records, goal stats, and advanced metrics highlight Villa’s momentum versus Chelsea’s historical consistency in the Premier League.
Key Highlights
| Team | Position | Points | Matches Played | Overview |
|---|---|---|---|---|
| Aston Villa | 3rd Place | 50 | 26 | Strong goal difference and consistency keeping them inside Champions League spots and in the title race. |
| Chelsea | 5th Place | 44 | 26 | Targeting European qualification with a solid campaign, slightly behind Villa in points. |
Form Insights
Aston Villa have delivered key wins and maintained a healthy goal difference, strengthening their top-four chances and potential title ambitions.
Chelsea remain competitive but have recorded more draws, resulting in a slightly lower points total compared to Villa.
Overall Head-to-Head Record
Goals & Scoring
Total Goals: Chelsea approx. 98 vs Aston Villa approx. 54.
Goals per Match: ~2.7 goals average per game.
Over 1.5 goals in ~75% of matches, with around 50% exceeding 2.5 goals.
️ Venue Breakdown
Stamford Bridge: Chelsea dominant (approx. 18 wins vs Villa ~6).
Villa Park: More balanced — Villa ~14 wins, Chelsea ~14+ including draws.
Recent Premier League Meetings
| Date | Fixture | Result |
|---|---|---|
| 27 Dec 2025 | Chelsea 1–2 Aston Villa | Villa comeback win |
| 23 Feb 2025 | Aston Villa 2–1 Chelsea | Villa home win |
| 1 Dec 2024 | Chelsea 3–0 Aston Villa | Chelsea dominant |
| 27 Apr 2024 | Aston Villa 2–2 Chelsea | Draw |
| 7 Feb 2024 | Aston Villa 1–3 Chelsea | Chelsea win |
| 26 Jan 2024 | Chelsea 0–0 Aston Villa | Goalless draw |
Trends & Context
Chelsea historically lead the rivalry in total wins and goals scored.
Recent seasons (2024–2026) show Aston Villa becoming increasingly competitive, securing important wins including away comebacks.
Ollie Watkins has been particularly effective in recent meetings, scoring key goals.
Aston Villa vs Chelsea: Momentum That Matters
Aston Villa: Winning Momentum
Strong winning streak — Villa recorded an 11‑game winning run across competitions, propelling them into title contention mid-season.
Key victories against big teams — wins over Chelsea, Manchester United, and Arsenal highlighted their competitive form.
League impact: Maintaining top-three/Champions League spots, applying pressure on Arsenal and Manchester City as 2025‑26 reaches its climax.
Chelsea: Inconsistent Patch
Recent form patchy with a mix of draws and losses interrupting promising performances — e.g., home loss to Villa, defeats and draws against Leeds and others.
League impact: Dropped points in crucial games, just outside the very top places, fighting for a Champions League spot.
Draws and slip-ups have kept Chelsea from climbing higher in a tight top-six table.
How Form Shapes the Table
Villa’s surge places them ahead or very close to the league leaders, partly due to their string of wins.
Chelsea, while in or near European spots, lack a forward run — late goals, defensive lapses, and dropped leads have cost them ground.
Going Forward
Villa’s strong form gives leverage in big fixtures — beating fellow top-siders boosts points and confidence.
Chelsea need more consistency: minimizing draws and slip-ups will be key to sustaining their European push.
Expected Goals & Defensive Metrics
Chelsea – Creating Chances
~49.94 expected goals (xG) this season (~1.92 xG per game). Actual goals scored: 47, closely tracking xG → efficient conversion.
Aston Villa – Creating Chances
Lower xG than Chelsea, actual goals: 37. Over-performing relative to xG → clinical finishing and tactical efficiency.
Chelsea – Defensive Solidity
xGA is low relative to xG for, conceding fewer expected chances. Actual goals conceded: 30 → defense efficient.
Aston Villa – Defensive Solidity
Balanced xGA, actual goals conceded: 27 → strong defensive execution including goalkeeping and blocks.
Goal Difference & League Impact
Chelsea +17 GD → strong offensive and defensive balance, supporting European push.
Villa +10 GD → slightly lower than position suggests, but effective finishing and key results keep them in title race.
Analytics shows Chelsea create more chances, Villa over-perform → tactical efficiency and finishing edge critical for league success.
Long-Term Premier League Position Trends
Chelsea – Historical Stability
Consistently finishing in top-three/European spots over Premier League era. Strong all-time points tally.
Regular top-six finishes; rarely in relegation battles → high all-time ranking.
Aston Villa – Volatile but Rising
Historically mid-table, fluctuating season to season. Never relegated despite ups and downs.
2025–26: Historic winning streak propels team into top-three/European contention — marked upward trend.
Recent Seasonal Trends
Villa: Slow start in 2025–26 → historic run of wins → massive mid-season improvement.
Chelsea: Maintained top-six consistency, minor fluctuations keep them slightly below best finishes in some seasons.
Key Takeaways
Stability vs Variability: Chelsea maintains consistent top-tier finishes; Villa’s recent surge shows mid-season form can reshape long-term trends.
Winning streaks and momentum swings can drastically affect standings trajectories, highlighting the dynamic nature of modern Premier League competition.
FAQs – Aston Villa vs Chelsea Trends
Conclusion
Chelsea remain historically dominant with consistent top‑table finishes, while Aston Villa’s recent form and momentum have pushed them into top‑tier contention, making their rivalry both competitive and impactful on the Premier League standings.

















Leave a Reply