

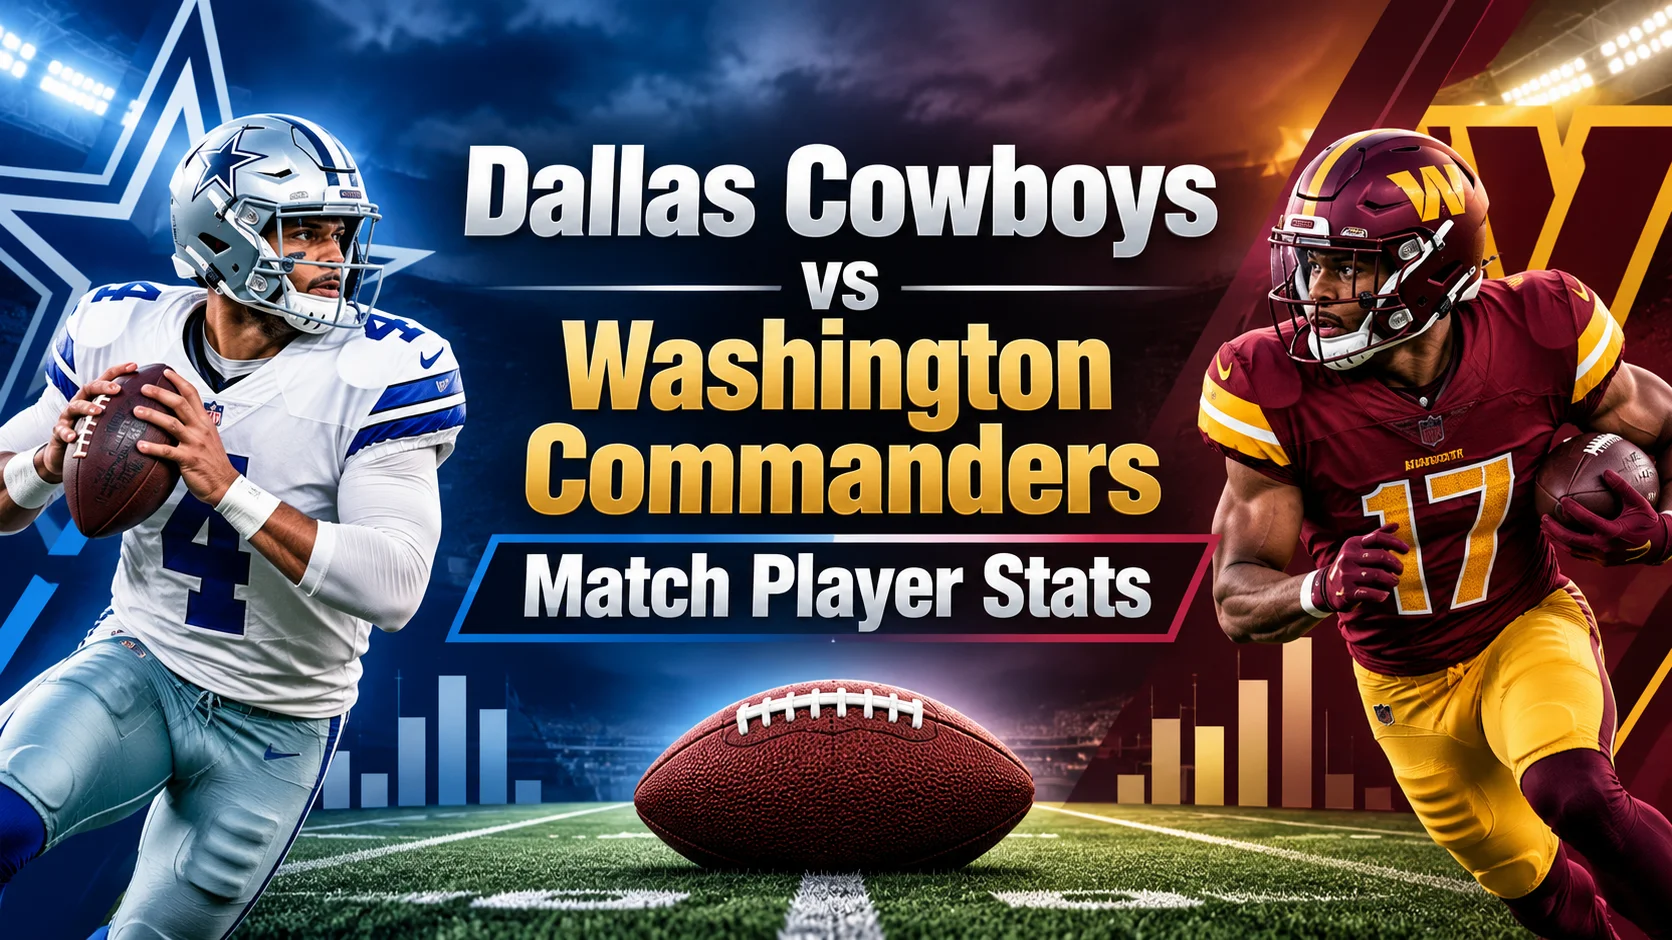
The NFC East features one of the most intense and historic rivalries in American sports: the Dallas Cowboys against the Washington Commanders. When these two storied franchises collide, individual matchups often dictate the outcome. Examining detailed player statistics across passing, rushing, receiving, and defense provides clear insight into how these division battles are won in the trenches and through the air.
Below is an in-depth statistical breakdown evaluating the key player performances, offensive metrics, and defensive impacts that define the Cowboys vs. Commanders matchup.
Quarterback Breakdown: Passing and Execution Under Pressure
The quarterback position is the primary engine for both franchises. Analyzing passing efficiency, completion percentage, yards per attempt, and touchdown-to-interception ratios reveals how each signal-caller attacks opposing defensive coverages.
Dallas’ offensive system often relies on high-volume passing and quick-release reads. Dak Prescott’s ability to command the pre-snap line of scrimmage and push the ball downfield into tight windows against division rivals remains a focal point. Conversely, Washington focuses on controlling tempo, using play-action setups to create high-percentage throws downfield.
Dallas Cowboys Passing Performance
Dak Prescott: 19/37 completions, 307 passing yards, 2 Touchdowns, 0 Interceptions, 97.5 Passer Rating.
4th Down Efficiency: 6/6 conversions.
Longest Completion: 86-yard touchdown pass to KaVontae Turpin.
Washington Commanders Passing Performance
Josh Johnson: 15/23 completions, 198 passing yards, 0 Touchdowns, 0 Interceptions, 92.3 Passer Rating.
Yards Per Attempt: 8.6 YPA.
Longest Completion: 41-yard completion to Deebo Samuel.
Quarterback Stat Comparison
| Metric | Dallas Cowboys (Dak Prescott) | Washington Commanders (Josh Johnson) |
| Completions / Attempts | 19 / 37 | 15 / 23 |
| Completion Percentage | 51.3% | 65.2% |
| Passing Yards | 307 | 198 |
| Yards Per Attempt | 8.3 | 8.6 |
| Touchdowns / INTs | 2 / 0 | 0 / 0 |
| Sacks Taken / Yards Lost | 6 / 38 | 2 / 8 |
| Passer Rating | 97.5 | 92.3 |
Rushing Dynamics: Backfield Production and Time of Possession
Establishing the ground game is crucial for setting up play-action and managing time of possession. The rushing dynamic showcases a strong contrast between Dallas’ heavy multi-back rotation and Washington’s reliance on explosive plays.
Dallas uses a combination of inside-zone runs and power concepts to wear down defensive fronts. Washington relies on explosive outside runs and perimeter toss plays to isolate defenders in open space.
Key Rushing Leaders
Malik Davis (DAL): 20 carries, 103 rushing yards, 0 Touchdowns, 5.15 YPC.
Javonte Williams (DAL): 13 carries, 54 rushing yards, 1 Touchdown, 4.15 YPC.
Jacory Croskey-Merritt (WAS): 11 carries, 105 rushing yards, 2 Touchdowns, 9.5 YPC (highlighted by a 72-yard touchdown run).
Hunter Luepke (DAL): 7 carries, 30 rushing yards, 0 Touchdowns.
Rushing Production Summary
| Player | Team | Carries | Rushing Yards | Yards Per Carry | Touchdowns | Longest Rush |
| Jacory Croskey-Merritt | WAS | 11 | 105 | 9.5 | 2 | 72 |
| Malik Davis | DAL | 20 | 103 | 5.15 | 0 | 18 |
| Javonte Williams | DAL | 13 | 54 | 4.15 | 1 | 12 |
| Hunter Luepke | DAL | 7 | 30 | 4.28 | 0 | 8 |
| Dak Prescott | DAL | 4 | 24 | 6.0 | 0 | 11 |
Receiving Corps: Target Distribution and Playmaking
The receiving volume highlights how each team spreads targets across wide receivers, tight ends, and running backs. Target share indicates defensive focus and tactical mismatches.
Dallas utilizes wide receiver CeeDee Lamb to draw top coverage safety help, opening up space for speed options like KaVontae Turpin and tight end Jake Ferguson. Washington targets playmaker Deebo Samuel and Terry McLaurin to gain yards after catch (YAC).
Primary Receiving Targets
KaVontae Turpin (DAL): 1 reception, 86 yards, 1 Touchdown.
Deebo Samuel Sr. (WAS): 2 receptions, 68 yards, 0 Touchdowns.
CeeDee Lamb (DAL): 5 receptions, 46 yards, 0 Touchdowns (10 targets).
Jalen Tolbert (DAL): 4 receptions, 31 yards, 0 Touchdowns (8 targets).
Jake Ferguson (DAL): 3 receptions, 28 yards, 1 Touchdown.
Defensive Impact: Pass Rush and Disruptive Plays
Defensive stats illustrate who controls the line of scrimmage. Sacks, tackles for loss (TFLs), and pressure rates determine whether offenses stay ahead of the chains.
Washington’s front line recorded notable interior pressure, while Dallas relied on perimeter edge rushing and secondary run support.
Top Defensive Performers
Jer’Zhan Newton (WAS): 3.0 Sacks, 3 Solo Tackles, 3 Tackles for Loss.
Jadeveon Clowney (DAL): 1.5 Sacks, 1 Tackle for Loss, 3 Solo Tackles.
Bobby Wagner (WAS): 10 Total Tackles, 92 Defensive Snaps (100% snap count).
Frankie Luvu (WAS): 8 Total Tackles, 92 Defensive Snaps (100% snap count).
Defensive Front Statistical Leaders
| Defensive Player | Team | Solo Tackles | Total Tackles | Sacks | Tackles for Loss (TFL) |
| Jer’Zhan Newton | WAS | 3 | 5 | 3.0 | 3 |
| Jadeveon Clowney | DAL | 3 | 4 | 1.5 | 1 |
| Bobby Wagner | WAS | 6 | 10 | 0.0 | 0 |
| Frankie Luvu | WAS | 5 | 8 | 0.0 | 1 |
| Sam Williams | DAL | 2 | 3 | 0.5 | 1 |
Game Flow and Strategic Execution
Evaluating overall team stats provides essential context for player-level performances. Factors such as time of possession, penalty yards, and total offensive snap count reflect which unit controlled the tempo.
Team Statistics Comparison
| Game Metric | Dallas Cowboys | Washington Commanders |
| First Downs | 28 | 17 |
| Total Offensive Plays | 87 | 41 |
| Total Yards | 480 | 328 |
| Rushing Yards | 211 | 138 |
| Passing Yards | 269 | 190 |
| Turnovers Lost | 0 | 0 |
| Time of Possession | 38:44 | 21:16 |
| Penalties / Yards | 11 / 85 | 10 / 75 |
Dallas dominated time of possession by over 17 minutes, running 87 total plays compared to Washington’s 41. This difference directly impacted player workloads, allowing Dallas running backs to accumulate 44 total rushing attempts. Meanwhile, Washington generated explosive plays on fewer total snaps, highlighted by Jacory Croskey-Merritt’s 72-yard touchdown run.
Special teams also played a key role. Dallas kicker Brandon Aubrey connected on field goals from 52 and 51 yards, securing late-game point separation.
Key Takeaways from the Individual Player Metrics
Analyzing player statistics from the Dallas Cowboys vs. Washington Commanders game reveals structural insights into both rosters:
Volume vs. Efficiency: Dallas won through offensive volume, racking up 28 first downs and 480 total yards across 87 plays.
Defensive Front Disruptions: Washington’s Jer’Zhan Newton delivered a strong interior pass rush with 3.0 sacks, disrupting Dallas’ passing rhythm despite the Cowboys’ time-of-possession dominance.
Big-Play Production: Washington produced high per-play efficiency (8.6 yards per pass attempt and 8.6 yards per carry), but was limited by a lower snap volume.
4th Down Conversions: Dak Prescott and the Dallas offense converted all six 4th-down attempts, extending drives and tiring the opposing defense.









dallas cowboys vs washington commanders match player stats - Football club menu
[…] a multi-dimensional offensive scheme, while Washington strove to maintain rhythmic, quick release passing sequences despite key injuries on their side of the […]