

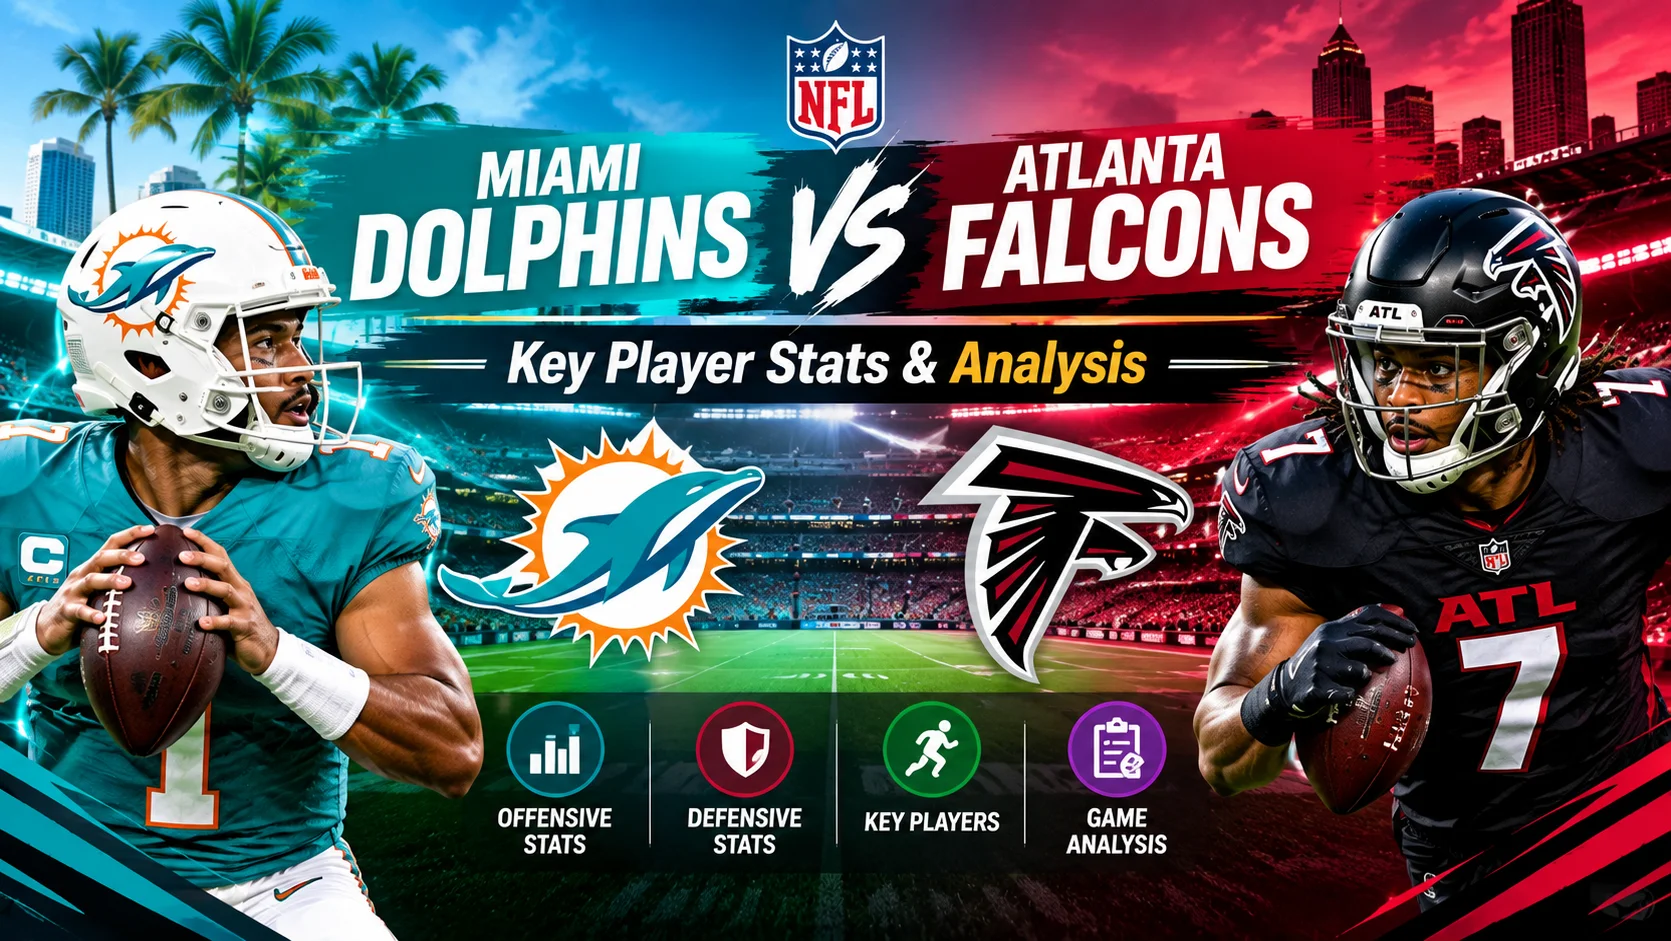
The Miami Dolphins and Atlanta Falcons met in a preseason matchup on August 28, 2026, at Hard Rock Stadium. Atlanta ultimately secured a 17-12 victory, but the scoreline does not tell the entire story. Instead, the game offered useful insight into quarterback play, rushing production, defensive pressure, and the ability of both teams to finish scoring opportunities.
For Miami, the game highlighted some promising rushing numbers but also exposed problems in pass protection and touchdown production. Meanwhile, Atlanta showed greater efficiency through the air and managed to create more decisive moments on offense.As a result, the matchup provides plenty of useful information for fans looking at Miami Dolphins vs Atlanta Falcons key player stats and overall team performance.
Final Score and Major Statistics
Atlanta entered the game strongly and built a 17-6 advantage before Miami responded with additional field goals. However, the Dolphins could not turn their offensive opportunities into touchdowns.
| Category | Atlanta Falcons | Miami Dolphins |
|---|---|---|
| Final Score | 17 | 12 |
| Completions | 26 | 11 |
| Pass Attempts | 33 | 24 |
| Passing Yards | 245 | 168 |
| Passing TDs | 1 | 0 |
| Interceptions | 1 | 0 |
| Rushing Yards | 40 | 78 |
| Rushing Attempts | 24 | 25 |
| Rushing TDs | 1 | 0 |
| Sacks Allowed | 1 | 5 |
The numbers show an interesting contrast. Although Miami produced more rushing yards, Atlanta was considerably more effective passing the football. In addition, Atlanta’s five sacks of Miami quarterbacks became an important factor in the result.
Atlanta Falcons Key Player Stats
Cooper Rush
Cooper Rush played an important role in Atlanta’s offensive performance. He completed 13 of 18 passes for 106 yards and one touchdown. His efficiency helped Atlanta maintain control during the first half.
Furthermore, Rush avoided an interception and finished with a 105.3 passer rating in the available box-score statistics. His ability to keep the offense moving was particularly valuable as Atlanta established its early advantage.
Tua Tagovailoa
Tua Tagovailoa also appeared for Atlanta and completed 7 of 8 passes for 95 yards. He averaged 11.9 yards per attempt and finished his limited appearance with a 116.1 passer rating.
Therefore, even though his sample size was small, his passing efficiency stood out. Tagovailoa’s arrival in Atlanta is also a notable storyline because he spent his previous six NFL seasons with Miami before joining the Falcons in 2026.
Brian Robinson Jr.
Brian Robinson Jr. contributed Atlanta’s rushing touchdown. He carried the ball five times for 14 yards, including a three-yard touchdown run.
While his rushing total was modest, the touchdown demonstrated Atlanta’s ability to finish an offensive drive. Ultimately, that finishing ability separated the Falcons from Miami on the scoreboard.
Jack Velling
Jack Velling also made an important contribution by catching a touchdown pass from Cooper Rush. His score helped Atlanta build its first-half cushion and gave the Falcons another example of their ability to convert opportunities into touchdowns.
Miami Dolphins Key Player Stats
Chris Miller
Chris Miller handled 16 passing attempts for Miami, completing seven passes for 71 yards. He did not throw an interception or touchdown pass, but he faced considerable pressure throughout his appearance.
In particular, Miami’s passing game struggled to maintain consistency as the Falcons generated multiple sacks. That pressure limited the offense’s ability to sustain drives.
Malik Gronowski
Malik Gronowski provided one of Miami’s more encouraging statistical performances. He completed 4 of 8 passes for 97 yards, giving him 12.1 yards per attempt.
Additionally, Gronowski rushed four times for 28 yards, averaging 7.0 yards per carry. Consequently, his combination of passing efficiency and rushing ability was one of the more notable individual positives for Miami.
Cam Wardington
Cam Wardington led Miami’s rushing attempts, carrying the ball 13 times for 34 yards. Although his 2.62 yards-per-carry average was not especially high, his workload helped Miami finish with 78 total rushing yards.
Miami’s rushing attack actually produced nearly twice as many yards as Atlanta’s. However, the Dolphins were unable to turn that advantage into a rushing touchdown.
Riley Patterson
Riley Patterson was responsible for all 12 of Miami’s points. He converted four field-goal attempts, including kicks from 46 and 45 yards.
As a result, Patterson’s accuracy kept Miami within striking distance even while the offense struggled to score touchdowns. His performance was particularly important because the Dolphins could not finish their drives in the end zone.
Passing Game Comparison
The biggest statistical advantage for Atlanta came through the passing game.
The Falcons completed 26 of 33 attempts, while Miami completed only 11 of 24. Atlanta also recorded 245 passing yards compared with Miami’s 168.
This difference matters because passing efficiency helped Atlanta generate sustained offensive possessions. Meanwhile, Miami’s quarterbacks faced much more pressure, with the Dolphins allowing five sacks.
The contrast was especially interesting because Miami actually generated better rushing numbers. Therefore, the game demonstrated how a team can control one area statistically but still lose because another area has a larger influence on scoring opportunities.
Rushing Attack Analysis
Miami finished with 78 rushing yards on 25 attempts, averaging 3.12 yards per carry. Atlanta recorded 40 rushing yards on 24 attempts, averaging only 1.67 yards per carry.
At first glance, this should have given Miami an advantage. However, Atlanta’s passing performance compensated for its weaker rushing production.
For Miami, Gronowski’s 28 rushing yards were particularly notable. The Dolphins also received 34 yards from Wardington. In contrast, Atlanta’s leading rusher, Robinson, finished with 14 yards but added a touchdown.
This illustrates an important point: total yardage does not always determine the winner. Red-zone execution and explosive plays can be just as important.
Defensive Performance and Pass Pressure
Atlanta’s Pass Rush
One of the clearest takeaways from the game was Atlanta’s ability to pressure Miami’s quarterbacks. The Falcons recorded five sacks, compared with just one by Miami.
Because of this, Miami had difficulty maintaining rhythm through the air. Pressure can disrupt timing, shorten routes, and force quarterbacks to make decisions before receivers have time to develop separation.
Miami’s Defensive Response
Miami’s defense did create some positive moments, including an interception. However, Atlanta still managed to produce enough offensive efficiency to establish a first-half lead.
Nevertheless, Miami’s ability to generate 78 rushing yards and keep Atlanta scoreless in the second half provided some encouraging signs.
What the Player Stats Tell Us
The Miami Dolphins vs Atlanta Falcons matchup demonstrates why individual statistics should always be viewed in context.
Atlanta’s quarterbacks combined for strong completion numbers, while Miami’s quarterbacks struggled to maintain passing efficiency. At the same time, Miami’s rushing attack generated substantially more yardage.
The biggest difference was ultimately scoring. Atlanta produced a rushing touchdown and a passing touchdown, while Miami relied entirely on field goals. Therefore, the Falcons were more successful at converting offensive production into points.
The game also showed the importance of pass protection. Five sacks against Miami created repeated negative plays and made it harder for the Dolphins to build scoring drives.
Key Takeaways for Both Teams
Atlanta Falcons
The Falcons can take confidence from their passing efficiency and ability to create pressure. Their quarterbacks combined for 245 passing yards, while the defense recorded five sacks.
Moreover, Atlanta demonstrated that scoring touchdowns rather than settling for field goals can create a decisive advantage.
Miami Dolphins
Miami’s strongest statistical area was rushing. The Dolphins produced 78 rushing yards and also received an encouraging dual-threat performance from Gronowski.
However, improving pass protection and finishing drives will be important areas to watch. Five sacks allowed and zero offensive touchdowns limited Miami’s ability to capitalize on its rushing production.
FAQs
1. Who won the Miami Dolphins vs Atlanta Falcons preseason game?
The Atlanta Falcons defeated the Miami Dolphins 17-12 on August 28, 2026.
2. Which team had more passing yards?
Atlanta had more passing yards, finishing with 245 yards compared with Miami’s 168.
3. Which team had more rushing yards?
Miami produced more rushing yards, recording 78 yards compared with Atlanta’s 40.
4. Who scored Miami’s points?
Kicker Riley Patterson scored all 12 of Miami’s points with four successful field goals.
5. What was the biggest statistical difference in the game?
The biggest difference was passing efficiency and quarterback pressure. Atlanta completed 26 of 33 passes and recorded five sacks, while Miami completed 11 of 24 passes and allowed five sacks.
Final Thoughts
The 17-12 Atlanta victory over Miami was a useful preseason test that revealed strengths and weaknesses on both sides. Atlanta’s passing efficiency, quarterback production, and defensive pressure helped create the winning formula.
Meanwhile, Miami showed promise on the ground and received four successful field goals from Patterson. Nevertheless, the Dolphins need greater consistency in the passing game and better protection if they want to turn yardage into touchdowns.











Leave a Reply