

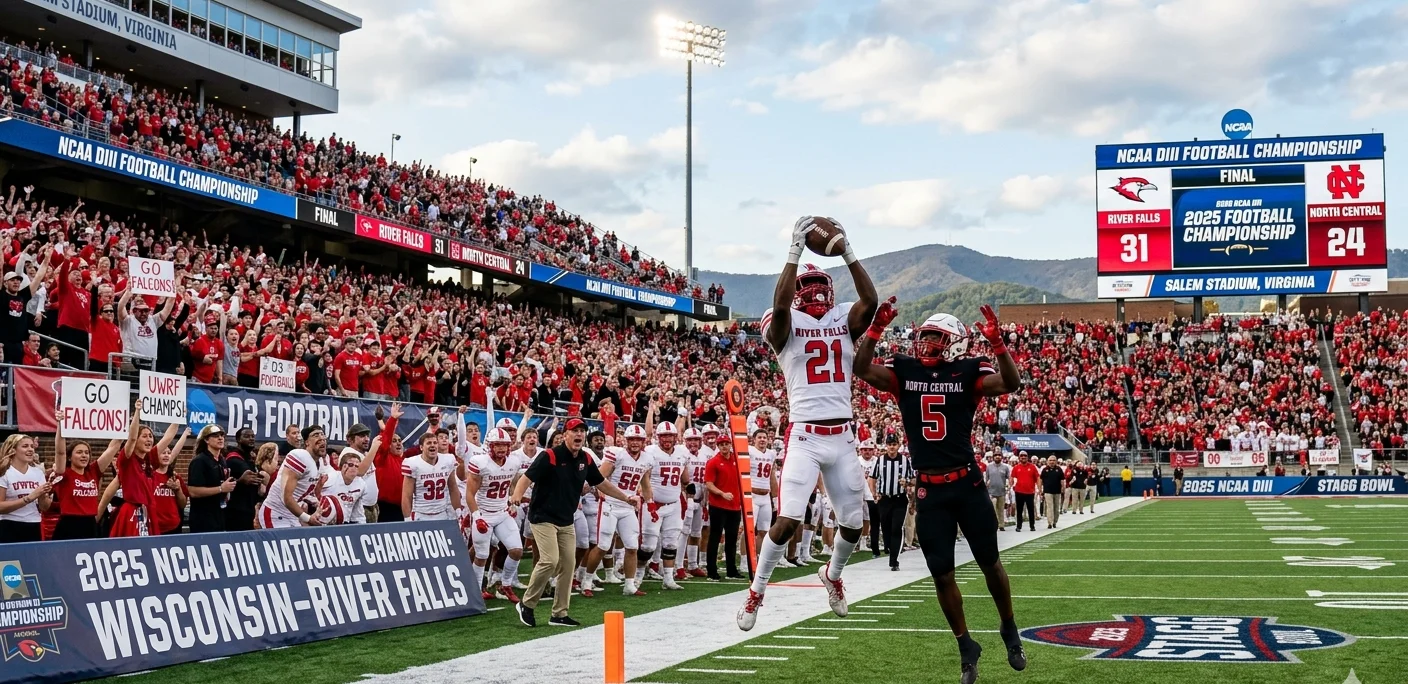
2025 NCAA D3 Football Rankings
The 2025 NCAA Division III football rankings track the performance and relative standing of collegiate football programs competing at the NCAA Division III level during the 2025 season. Unlike the Football Bowl Subdivision (FBS), Division III determines its national champion through a single-elimination postseason tournament culminating in the Stagg Bowl rather than bowl games or playoff points systems.
National Rankings (Official NPI + Coaches Poll)
Below is an overview of the official national standings for the 2025 NCAA Division III football season, combining the NCAA’s Net Points Index (NPI) — the primary metric used to evaluate teams for playoff selection — with the AFCA Coaches Poll, a respected human ranking system used throughout the year.
Official NPI Rankings
NPI Rankings provide a data-driven national snapshot used for playoff seeding and selection, with programs such as Mount Union, Wartburg, and North Central leading the charts.
| Rank (NPI) | Team | Record / NPI |
|---|---|---|
| 1 | Mount Union | 10-0 / 79.442 |
| 2 | Wartburg | 10-0 / 77.944 |
| 3 | North Central (IL) | 10-0 / 76.068 |
| 4 | Bethel (MN) | 10-0 / 75.047 |
| 5 | UW-River Falls | 9-1 / 75.042 |
AFCA Coaches Poll
The AFCA Coaches Poll is voted on weekly by Division III coaches and reflects a human evaluation of the Top 25 teams based on performance, strength of schedule, and overall quality of play.
| Coaches Poll Rank | Team |
|---|---|
| 1 | UW-River Falls |
| 2 | North Central College |
| 3 | John Carroll University |
| 4 | Johns Hopkins University |
| 5 | Bethel University |
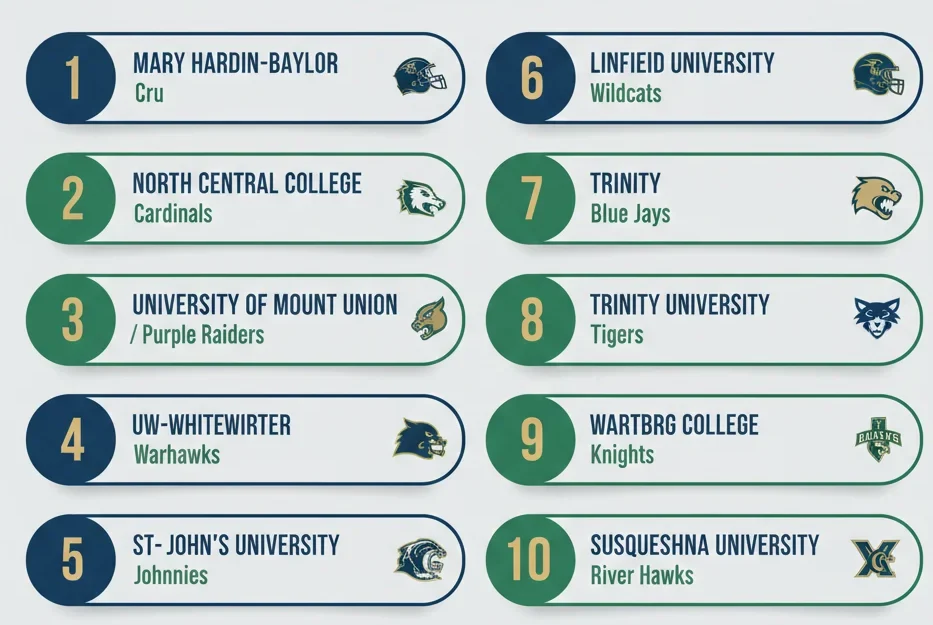
Regional Rankings
In addition to national rankings, the NCAA Division III football season also features regional rankings that highlight the strongest teams within each of the six geographic regions used for postseason evaluation. These lists are based primarily on the NCAA’s Net Points Index (NPI) and in-division records.
Region I
- Endicott (9–1) — 68.064
- Eastern (9–1) — 67.158
- Springfield (8–2) — 64.517
- Merchant Marine (7–2) — 61.369
- Curry (8–2) — 61.071
- Trinity (CT) (7–2) — 60.994
- University of New England (8–2) — 60.758
Region II
- Christopher Newport (10–0) — 77.538
- Johns Hopkins (9–1) — 75.017
- Franklin & Marshall (9–1) — 70.209
- Salisbury (9–1) — 68.616
- Muhlenberg (8–2) — 66.043
- Cortland (8–2) — 64.485
- Susquehanna (8–2) — 64.149
How Rankings Are Calculated
Understanding the methodology behind NCAA Division III football rankings helps explain why certain teams rise or fall in both national and regional standings. Rankings rely on a combination of objective data and human evaluation, ensuring both statistical performance and expert judgment are considered.
Net Points Index (NPI)
The NPI is the NCAA’s primary quantitative metric for ranking teams. It incorporates multiple factors:
- Win-Loss Record: Teams earn points for wins, with more weight given to victories against strong opponents.
- Strength of Schedule: Quality of opponents faced matters; beating highly-ranked teams boosts NPI more than wins over weaker teams.
- Scoring Margin: Points scored versus points allowed, capped to prevent excessive running up the score.
AFCA Coaches Poll
The AFCA Coaches Poll is voted on weekly by Division III coaches. It is based on expert judgment rather than strict formulas:
- Coaches assess team performance, including wins, losses, and margins.
- They consider strength of schedule, injuries, and recent trends in team play.
- Voters rank the top 25 teams; these rankings are aggregated to produce the poll standings.
Regional Rankings
Regional rankings combine NPI data and competitive context within each geographic area:
- Performance against regional opponents
- Head-to-head results
- Strength within the region, especially in strong conferences
Final Rankings Considerations
At the end of the season, the NCAA Division III Football Committee reviews:
- NPI standings
- AFCA Coaches Poll results
- Conference championships and automatic qualifiers
- Head-to-head results, travel considerations, and historical context
Weekly Movement & Trends
Tracking weekly movement and trends in the 2025 NCAA Division III football rankings provides insight into how teams rose or fell in the eyes of poll voters — and how on-field performance translated into perception throughout the season. In Division III, the D3football.com Top 25 and the AFCA Coaches Poll updated weekly, with teams climbing, sliding, entering, and exiting the rankings based on results, strength of schedule, and consistency.
Trend Themes Across 2025
- Consistent Leaders: Top programs like North Central showed remarkable consistency, staying atop polls week after week.
- Mid‑Season Movers: Several teams climbed steadily through the rankings as resumes strengthened — a sign of competitive balance beyond the perennial powers.
- Late‑Season Adjustments: The final polls reflected postseason positioning, with upward moves often tied to strong finishes and playoff implications.
Conference Strength Breakdown
Analyzing conference strength is critical for understanding how NCAA Division III football rankings are shaped. Strong conferences produce multiple ranked teams and often dominate playoff positions and seeding.
Central College and Midwest Conferences
- Conferences: CCIW and NCAC remain dominant in 2025.
- Top Programs: North Central (IL), Wheaton (IL), and John Carroll consistently rank highly.
- Trends: Strong schedules keep these teams stable in rankings throughout the season.
Upper Midwest and Minnesota Conferences
- Conferences: MIAC and WIAC are highly competitive leagues.
- Top Programs: UW-River Falls, Bethel (MN), Saint John’s, and UW-Whitewater show strong depth.
- Trends: Late-season games heavily impact playoff seeding and rankings.
Frequently Asked Questions
Conclusion
The 2025 NCAA Division III football season showcased the depth, competitiveness, and regional diversity of collegiate football programs across the country. National rankings, such as the NPI and AFCA Coaches Poll, combined with detailed regional standings, provided a comprehensive view of team performance and playoff positioning.











Leave a Reply