

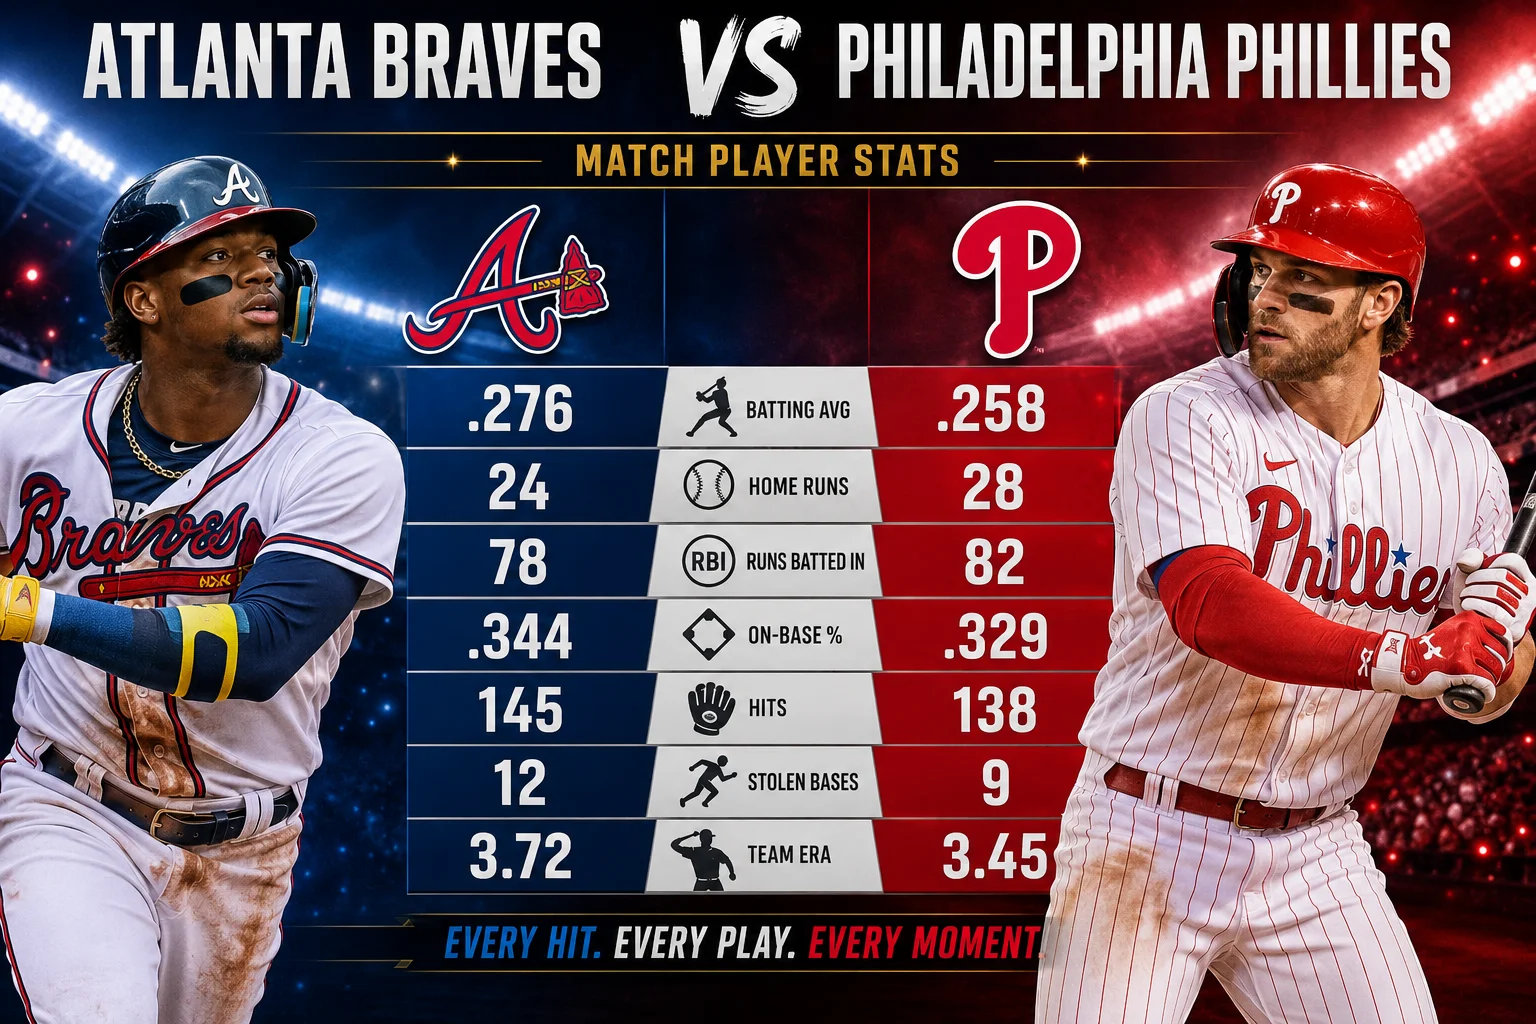
Few rivalries in Major League Baseball carry the intense drama, divisional weight, and pure star power of the National League East battle between the Atlanta Braves and the Philadelphia Phillies. Every time these two powerhouses meet, baseball fans are treated to a masterclass in power hitting, elite starting pitching, and high leverage bullpen management.
In their recent matchup, the Atlanta Braves secured a decisive 6–2 victory over the Philadelphia Phillies at Truist Park. Driven by a dominant performance on the mound and timely run support from the core of the lineup, Atlanta showcased why they remain a premier threat in the division. Meanwhile, Philadelphia’s star studded order battled through high stress innings but struggled to cash in with runners in scoring position.
Below is an in depth breakdown of the game, individual player statistical highlights, and key takeaways from this NL East thriller.
Game Summary: How the Braves Controlled the Rhythm
The contest opened with elevated intensity as both starting pitchers set an aggressive tone early. Ace lefty Chris Sale took the mound for Atlanta, demonstrating sharpness across his slider fastball mix. Facing a formidable Phillies lineup featuring Trea Turner, Kyle Schwarber, and Bryce Harper, Sale controlled the strike zone and racked up key strikeouts to keep Philadelphia off the board in the opening frames.
On the other side, Philadelphia’s right hander Aaron Nola sought to suppress Atlanta’s explosive bats. However, the Braves drew early walks and leveraged hard contact hits from Ronald Acuña Jr. and Matt Olson to build momentum. Atlanta broke the game open in the mid-innings, stringing together double-digit hits to build a comfortable lead.
Although Philadelphia responded late with solo efforts and persistent plate appearances, Atlanta’s bullpen bridged the final innings effectively to seal the 6–2 outcome.
Player Performance Breakdown & Statistical Comparison
Baseball is fundamentally a game of individual duels that collective box scores reveal. The numbers from this contest highlight how Atlanta capitalized on key scoring opportunities while pitching dynamically out of jams.
Atlanta Braves Batting Statistics
Atlanta’s lineup combined for 10 hits and 3 walks, proving relentless at the plate. Ronald Acuña Jr. set the tempo at the top of the order, while Matt Olson and Austin Riley provided the heavy lifting in the heart of the lineup.
| Player Name | Position | At-Bats (AB) | Runs (R) | Hits (H) | RBIs | Walks (BB) | Strikeouts (SO) |
| Ronald Acuña Jr. | OF | 4 | 2 | 2 | 1 | 1 | 1 |
| Drake Baldwin | C | 4 | 0 | 1 | 0 | 0 | 1 |
| Matt Olson | 1B | 4 | 1 | 2 | 2 | 0 | 1 |
| Ozzie Albies | 2B | 4 | 1 | 1 | 1 | 0 | 0 |
| Michael Harris II | OF | 4 | 1 | 2 | 1 | 0 | 1 |
| Austin Riley | 3B | 3 | 1 | 1 | 1 | 1 | 1 |
| Mauricio Dubón | SS | 3 | 0 | 1 | 0 | 1 | 1 |
| Eli White | OF | 4 | 0 | 0 | 0 | 0 | 1 |
| Jorge Mateo | INF | 3 | 0 | 0 | 0 | 0 | 1 |
| Team Total | — | 33 | 6 | 10 | 6 | 3 | 8 |
Philadelphia Phillies Batting Statistics
Philadelphia struggled to sync up their hits, generating only 2 hits on the day against Atlanta’s effective pitching rotation. While top hitters like Trea Turner and Bryce Harper reached base via walks, the lineup was unable to assemble a large rally.
| Player Name | Position | At-Bats (AB) | Runs (R) | Hits (H) | RBIs | Walks (BB) | Strikeouts (SO) |
| Trea Turner | SS | 3 | 1 | 0 | 0 | 1 | 1 |
| Kyle Schwarber | DH | 4 | 0 | 0 | 0 | 0 | 2 |
| Bryce Harper | 1B | 3 | 1 | 1 | 1 | 1 | 1 |
| Félix Reyes | OF | 4 | 0 | 0 | 0 | 0 | 2 |
| Brandon Marsh | OF | 3 | 0 | 1 | 1 | 0 | 1 |
| Adolis García | OF | 3 | 0 | 0 | 0 | 0 | 2 |
| Alec Bohm | 3B | 3 | 0 | 0 | 0 | 0 | 1 |
| Edmundo Sosa | 2B | 3 | 0 | 0 | 0 | 0 | 1 |
| Bryson Stott | 2B | 2 | 0 | 0 | 0 | 0 | 1 |
| Rafael Marchan | C | 2 | 0 | 0 | 0 | 0 | 0 |
| Team Total | — | 30 | 2 | 2 | 2 | 2 | 12 |
Pitching Analysis: Dominance on the Mound
Pitching dictated the tempo of this game. Atlanta’s pitching staff racked up 12 strikeouts while allowing just 2 earned runs.
Atlanta Braves Pitching Performance
Chris Sale led the charge for the Braves, using his deceptive delivery to notch 8 strikeouts and control the high-stress moments. The bullpen—comprising Joel Payamps, Aaron Bummer, and Robert Suárez closed out the final frames without allowing a run.
| Pitcher Name | Role | Innings Pitched (IP) | Hits (H) | Runs (R) | Earned Runs (ER) | Walks (BB) | Strikeouts (SO) |
| Chris Sale | Starter (W) | 6.0 | 2 | 2 | 2 | 1 | 8 |
| Joel Payamps | Relief | 1.0 | 0 | 0 | 0 | 1 | 2 |
| Aaron Bummer | Relief | 1.0 | 0 | 0 | 0 | 0 | 1 |
| Robert Suárez | Closer | 1.0 | 0 | 0 | 0 | 0 | 1 |
| Team Total | — | 9.0 | 2 | 2 | 2 | 2 | 12 |
Philadelphia Phillies Pitching Performance
Aaron Nola worked through 5.1 innings but suffered from Atlanta’s relentless contact, allowing 6 earned runs on 10 hits. The Phillies’ bullpen trio of Chase Shugart, Tim Mayza, and Nolan Hoffman stabilized the game, allowing no further runs across the final 2.2 innings.
| Pitcher Name | Role | Innings Pitched (IP) | Hits (H) | Runs (R) | Earned Runs (ER) | Walks (BB) | Strikeouts (SO) |
| Aaron Nola | Starter (L) | 5.1 | 10 | 6 | 6 | 2 | 5 |
| Chase Shugart | Relief | 1.0 | 0 | 0 | 0 | 1 | 1 |
| Tim Mayza | Relief | 0.2 | 0 | 0 | 0 | 0 | 1 |
| Nolan Hoffman | Relief | 1.0 | 0 | 0 | 0 | 0 | 1 |
| Team Total | — | 8.0 | 10 | 6 | 6 | 3 | 8 |
Tactical Highlights & Tactical Takeaways
1. Lineup Depth Makes the Difference
The primary distinction between the two clubs in this matchup was productivity from top to bottom. Atlanta received multi-hit games from Ronald Acuña Jr., Matt Olson, and Michael Harris II, ensuring that scoring opportunities were constantly created. Conversely, Philadelphia’s bottom half of the batting order was kept silent by Chris Sale’s precise locations.
2. High-Leverage Pitching Efficiency
Atlanta’s pitching staff maintained an excellent strikeout-to-walk ratio (12 Ks to 2 BBs). By avoiding unnecessary base runners, Sale and the bullpen prevented the Phillies’ dangerous power hitters from coming to the plate with multiple runners on base.
3. NL East Race Context
Every head-to-head meeting between these two rivals carries immense weight in the National League standings. With Atlanta taking this victory, they continue to assert control over the series, proving that their combination of frontline pitching and balanced hitting remains one of the toughest matchups in baseball.











Leave a Reply