
Man City vs Tottenham Stats – Head‑to‑Head & Advanced Analytics
Head‑to‑Head Overview
All Competitions (Overall History):
Manchester City and Tottenham Hotspur are historically very even rivals, with both clubs having 69 wins each and 37 draws from 175 meetings.
Premier League Record
In league play (since the Premier League era), City and Spurs remain closely matched — City has a slight edge by wins but the rivalry shows many competitive results.
Notable Recent Results
- August 2025 — Tottenham won 2–0 at the Etihad Stadium, a major statement in the fixture.
- February 2026 — Draw 2–2 at Tottenham Hotspur Stadium, showing how closely contested modern meetings can be.
Recent Match Analytics & Key Metrics
1) Possession & Passing
In the August 2025 Premier League clash:
- Man City had ~61% possession and completed 456 accurate passes with 87% accuracy.
- Tottenham held ~39% possession, focusing on defensive structure and counter‑attacks.
2) Expected Goals (xG) Insights
- Aug 23, 2025 (0–2): Man City xG ≈ 1.37 vs Tottenham xG ≈ 1.24.
- Dec 3, 2023 (3–3): City’s xG ≈ 2.61 vs Spurs ≈ 0.53.
- May 14, 2024 (0–2): City’s xG ≈ 2.41 vs Spurs ≈ 1.62.
Overview – Key Stats Comparison
Win / Loss / Draw (All Competitions)
| Result | Number of Matches |
|---|---|
| Total Head‑to‑Head Matches | 175 |
| Manchester City Wins | 69 |
| Tottenham Wins | 69 |
| Draws | 37 |
This shows how closely contested the fixture has been historically — nearly identical wins for both teams and a significant number of draws in their rivalry.
Total Goals Scored (All Competitions)
Total Goals in Rivalry: ~450 goals (City 236, Spurs 214) across all gatherings.
This illustrates a relatively high-scoring history, with both sides finding the net regularly over years of competition.
Average Goals per Match
While exact figures vary by source and span of data included, multiple records put the average total goals per fixture in the City vs Spurs rivalry at roughly ~2.9 to ~3.3 goals per match — pointing to frequent goal involvement from both teams.
Recent Match Stats
Below is a breakdown of team metrics (shots, possession, expected goals) for three recent Manchester City vs Tottenham Hotspur matches, showing how performances have varied in key statistical areas.
Match 1 – Tottenham 2‑2 Manchester City (1 Feb 2026)
Competition: Premier League
Result: Tottenham 2 – 2 Manchester City
- Possession: City ~60.7% vs Spurs ~39.3%
- Shots: City 15 vs Spurs 12
- Shots on Target: City 3 vs Spurs 6
- Expected Goals (xG): City ~1.99 vs Spurs ~0.97
- Corners: City 4 vs Spurs 3
Key Insight: City controlled possession and created slightly higher xG, but Spurs were more efficient with shots on target, helping them recover from a 2‑0 half‑time deficit to draw.
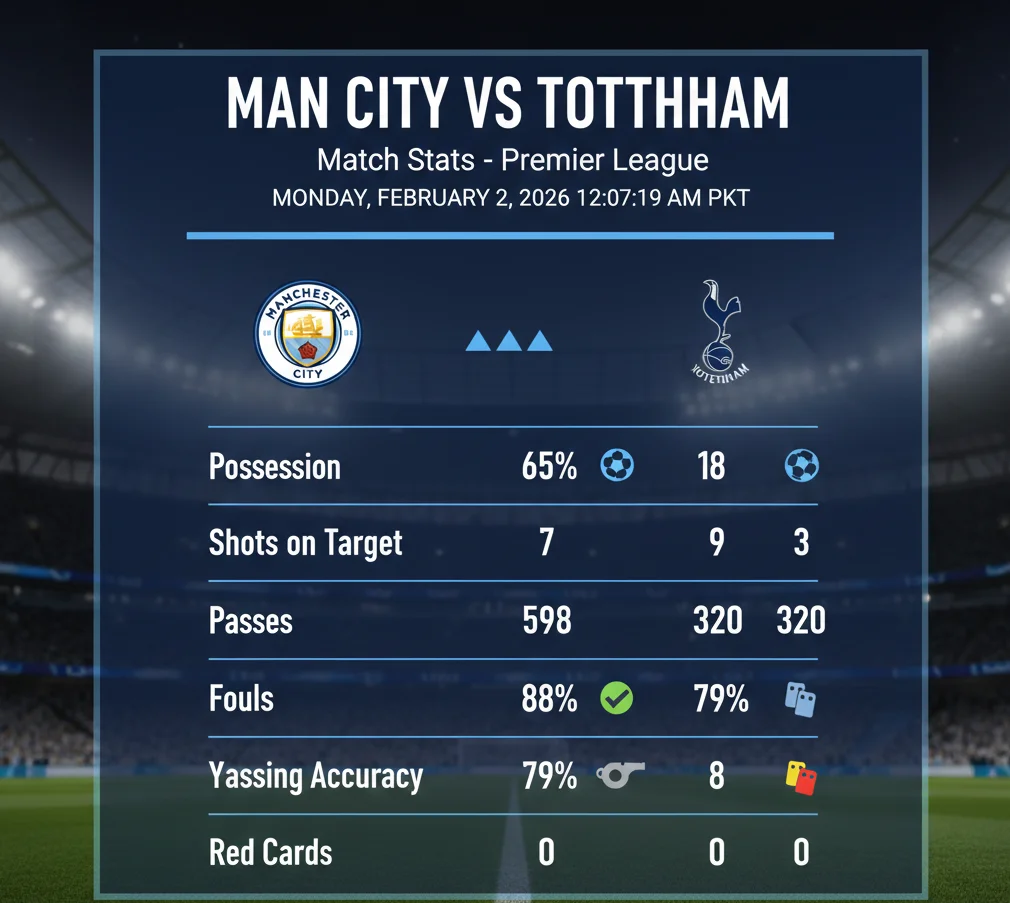
Match 2 – Manchester City 0‑2 Tottenham (23 Aug 2025)
Competition: Premier League
Result: Manchester City 0 – 2 Tottenham Hotspur
- Possession: City ~61% vs Spurs ~39%
- Shots: City 10 vs Spurs 12
- Shots on Target: City 4 vs Spurs 5
- Expected Goals (xG): City ~1.55 vs Spurs ~1.11
- Pass Accuracy: City ~87% vs Spurs ~78%
- Corners: City 7 vs Spurs 2
Key Insight: Despite controlling possession, City couldn’t convert chances and Spurs capitalised clinically — the visitors edged the match with better finishing and netted twice on the road.
Match 3 – Tottenham 0‑2 Manchester City (14 May 2024)
Competition: Premier League
Result: Tottenham Hotspur 0 – 2 Manchester City
- Possession: Spurs ~53% vs City ~47%
- Shots: Spurs 8 vs City 10
- Shots on Goal: Spurs 5 vs City 5
- Pass Accuracy: Both teams ~89%
- Corners: Spurs 7 vs City 4
- Expected Goals (xG): —
Key Insight: This encounter was balanced in possession and chances, but City were sharper in finishing with Erling Haaland scoring both goals — illustrating City’s ability to win even when not dominating stats.
Summary – Recent Match Stats Comparison
| Match | Possession | Shots | Shots on Target | xG | Result |
|---|---|---|---|---|---|
| Feb 1 2026 | City ~60.7% | 15 vs 12 | 3 vs 6 | ~1.99 vs ~0.97 | 2‑2 Draw |
| Aug 23 2025 | City ~61% | 10 vs 12 | 4 vs 5 | ~1.55 vs ~1.11 | Spurs 2‑0 |
| May 14 2024 | Spurs ~53% | 8 vs 10 | 5 vs 5 | — | City 2‑0 |
Head‑to‑Head Stats & Trends – Manchester City vs Tottenham Hotspur
Below is a data‑driven overview of how Manchester City and Tottenham Hotspur have fared against each other over time, focusing on win percentages over 5‑ and 10‑year windows, goals scored and conceded trends, and over/under goals patterns in their head‑to‑head matchups.
Win % Timeline (5yr / 10yr)
5-Year Window (Approx. 2016–2026)
Over the most recent decade of Premier League and cup encounters, the rivalry has remained competitive:
- Both teams have a near‑balanced record with similar win totals across their meetings (~155 matches; draws significant).
- Specific head‑to-head records show long-term balance: Manchester City and Tottenham each picked up around 61 wins with 33 draws, illustrating no complete dominance.
10-Year Trend (Longer View)
- City has a slight edge in wins and overall performance over a longer timeframe.
- Spurs recorded notable victories, including memorable wins in the 2024/25 and 2025/26 seasons.
- Close results — multiple draws and alternating winners — mean win percentage gaps tighten rather than widen.
Summary: Head-to-head win percentages over both 5-year and 10-year windows reflect a competitive rivalry with no persistent dominance.
Goals For / Against Trend
- Average scoring: ~2.9 goals per game in head-to-head matches.
- City scores ~1.4 goals/game, Spurs similar, showing balanced offensive/defensive output.
- Recent meetings often feature multiple goals, including 2–2 draws and 4–0 outcomes.
- Both teams regularly contribute to attacks and concessions — trend peaks in key Premier League matches.
Summary: Goals per match typically range ~2.8–3.0, with balanced contributions from both sides.
Over / Under Goals Trend
- Over/Under 2.5 Goals: Majority of matches produce over 2.5 goals. Example: 32/57 matches (~56%) from 1992–present.
- Both Teams to Score (BTTS): Frequent BTTS — 30/57 matches (>50%).
- Over 1.5 goals: ~56–93% depending on season/context. Over 3.5 or 4.5 goals appear less often but do occur in high-scoring fixtures.
Summary: Over/under trends favor >2.5 goals, with frequent BTTS, emphasizing the attacking nature of this rivalry.
Advanced Team Analytics
Expected Goals vs Actual Goals
Analyzing recent Manchester City vs Tottenham games shows how expected goals (xG) compare with actual outcomes — highlighting chance quality vs finishing efficiency:
- Man City 0–2 Spurs (Aug 23, 2025): City xG ~1.37 vs Spurs ~1.24 — actual 0–2; Spurs clinical conversion.
- Man City 3–3 Spurs (Dec 3, 2023): City xG ~2.61 vs Spurs ~0.53 — City dominated chance quality; Spurs overperformed relative to xG.
- Man City 4–2 Spurs (Jan 19, 2023): City xG ~2.37 vs Spurs ~1.00 — xG aligned with actual goals; City converted well.
- Tottenham 0–2 Man City (May 14, 2024): City xG ~2.41 vs Spurs ~1.62 — results match xG closely, City created stronger chances.
Trend Insight: City often generate higher xG via sustained pressure but don’t always convert. Spurs are efficient on counters, and disparities between xG and actual goals highlight finishing quality or defensive interventions.
Possession Over Time
- Man City 0–2 Spurs (Aug 2025): City ~61.4% possession vs Spurs ~38.6% — lost despite dominance.
- Tottenham 0–2 Man City (May 2024): Spurs ~53% vs City ~47% — relatively balanced, but City created higher quality chances.
Trend Insight: City typically enjoy higher possession, reflecting a control-oriented style. Spurs rely on transitional play; effectiveness depends on chance quality, not sheer possession.
Passing Networks & Pressing Metrics
- Passing & Build-Up: Aug 2025: City completed 456 passes (~86.9% accuracy) vs Spurs ~78.2%, showing superior build-up precision.
- Play Styles: City’s possession dominance creates more touches in opposition third; Spurs use more direct or transitional play.
- Pressing: Spurs often press intensely but high turnover rates don’t always produce clear chances. League-wide trends show modest decline in pressing with more direct play disrupting traditional press.
Player Comparison Stats — Top Performers
| Metric | Manchester City | Tottenham Hotspur |
|---|---|---|
| Top Goalscorer | Erling Haaland – 20 goals | Richarlison – 7 goals |
| Expected Goals (xG) | Haaland – ~18.36 | Collective below top tier; no Spurs player high in overall league xG |
| Key Passes / Creativity | Rayan Cherki – high xA | Moderate creators like Palhinha / Johnson contributing key touches |
| Pressing / Defensive Actions | Midfield / forward press patterns vary; Solanke noted for high pressure | Palhinha drives midfield recoveries and pressing stats |
Tactical Interpretation (Narrative) — What the Stats Say About Team Playing Style
Manchester City — Possession & High-Volume Chance Creation
Dominant Possession Play: City consistently registers 55–65% possession against Spurs, often controlling the midfield and dictating tempo. High pass accuracy (~86–88%) reflects a patient build-up approach, using short, precise passes to progress into the final third.
Attacking Focus via High xG Players: Erling Haaland leads in goals and xG, supported by creative midfielders like Rayan Cherki and Phil Foden. The stats indicate structured chance creation, with City generating multiple high-quality shots per game, often exceeding 15–20 shots even against organized defenses.
Pressing & Positional Discipline: City’s pressing metrics indicate positional pressing, designed to recover the ball high but not aggressively over-commit. Possession control and structured press allow City to sustain attacks and limit transitional opportunities for Spurs.
Narrative Summary: City’s style is possession-dominant, patient, and data-driven, focusing on volume, quality of chances, and high xG creation. Even when finishing falls short of xG, they maintain territorial dominance.
Tottenham Hotspur — Efficient Transitions & Selective Pressing
Counter-Attacking Efficiency: Spurs often operate with lower possession (~35–45%) but maximize goal efficiency from fewer chances. Players like Richarlison and Brennan Johnson thrive in quick transitional attacks, exploiting space behind City’s defensive lines.
Pressing to Force Errors: Palhinha and Solanke’s pressing stats indicate targeted, high-intensity pressing, often in the midfield or around City’s backline. Spurs rely on pressing opportunistically, rather than full-game possession pressure, creating turnovers in high-value zones.
Balanced Offensive Contribution: Spurs’ attacking stats show fewer shots overall, but a higher ratio of shots to goals in key matches, suggesting a clinical finishing approach. Midfield and wing players contribute to key passes and space exploitation, emphasizing efficiency over volume.
Narrative Summary: Spurs’ style is reactive yet efficient, with selective pressing, rapid counter-attacks, and clinical finishing. Stats indicate their strategy is designed to capitalize on opponent mistakes while controlling risk.
Frequently Asked Questions
1. What is the overall head-to-head record between Manchester City and Tottenham Hotspur?
Historically, the rivalry is very balanced. Out of 175 meetings, Manchester City and Tottenham have each won 69 games, with 37 draws.
2. Who are the top scorers for both teams in recent seasons?
Erling Haaland leads Manchester City with 20 goals, while Richarlison tops Tottenham with 7 goals in the same period.
3. How often do both teams score in head-to-head matches?
Both Teams to Score (BTTS) occurs frequently — in over 50% of historical fixtures, meaning both sides often find the net in these games.
4. What are the typical possession stats when these teams meet?
Manchester City usually controls 55–65% possession in matches, whereas Tottenham often holds 35–45%, reflecting a more counter-attacking approach.
5. How do expected goals (xG) compare with actual goals in these fixtures?
City often generate higher xG through sustained attacks but don’t always convert fully. Spurs sometimes score more efficiently from fewer chances, especially on counters.

Leave a Reply